
The landscape in the PEO industry is changing very rapidly. Today’s operators must navigate swiftly through a mountain of information to gain the timely insights needed to successfully compete in a fast moving and very competitive environment. The days of solely relying on historical information to run our business is like traveling the road to the future through the lens of the rearview mirror.
With yesterday’s tools, by the time an operator has quantified these historical metrics, most of the results are obsolete and opportunities are missed.
McHenry Consulting, Inc. has launched its Big Data service offerings which are now integrated as a fundamental platform of both its Mergers and Acquisitions practice and its Business Advisory practices.
In its pursuit of providing its clients with the highest level of performance and profitability optimization strategies, the firm has selected Tableau as the big data engine and the bedrock of its new business intelligence and analytics services.
According to Gartner’s Magic Quadrant Report, Tableau is the “gold standard for intuitive interactive exploration.”
The most common uses for a PEO, but not limited to, are the following:
Assessing client profitability
- By Cohort
- By service offering
- By GP
- $ Per WSE
- GP Composition
- By period
- By NAICS Code
- By Salesperson
- By Geography
- By Client Size
Financial Engineering
o The speed and quantifying and computing the financial impact of price increases or pruning unprofitable business
o Quantifying the financial impact on profitability real-time for changes in risk factors
Sales Analytics
- By salesperson
- Pipeline analysis
- By profitability
- By Activity level
- By Close Ratio
- By sales channel
- By referral source
- By NAICS code
- By WC loss ratio
- By Healthcare loss ratio
- By UI Loss Ration
- By Service
- Time lapse visualizations
- Sales person productivity trending over time
By Market
- Same as above
By NAICS Code
- Same as above
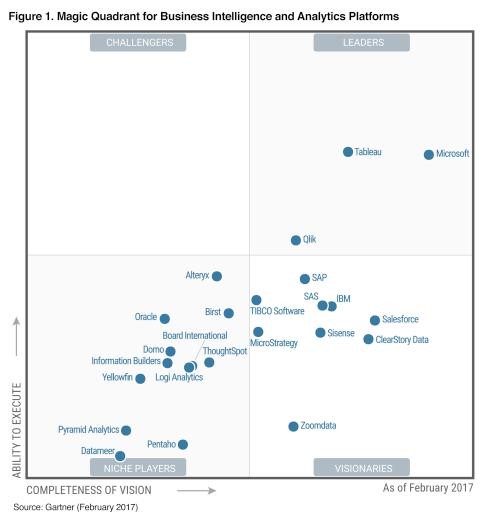
Tableau continues to be the market leader in business intelligence.
The power of Tableau is based upon its ability to tie data together from different sources that are adjoined by a common feature like a client ID number or salesperson.
Think about a series of files that are exported from your PEO software, your insurance carrier(s), state UI reports, from a CRM system such as salesforce, and sales commission reports that can be analyzed into a collective group of visualizations and insights as fast as the corresponding files can be updated.
Once the data files are mapped, the analytics and visualization insights can be updated real-time when new information or reports become available. Financial data and operating data can be adjoined to provide clear, insightful, and actionable insights that may allow you to stay ahead of the competition.
How much is getting the right information on a timely basis worth? How important is it to you to know the productivity of your salesforce real-time? How much money are you leaving on the table without real-time insights to your profitability?
How much is it worth to quickly identify a failure in your service delivery system? How much is it worth to have the insights to act faster than your competition to capitalize on opportunities?
Nimble and agile are the qualities that are now inherent in the most successful organizations.
Rupert Murdoch once famously said:
“The world is changing very fast. Big will not beat small anymore. It will be the fast beating the slow.”
If you would like more information on the power of big data and how it can impact your performance and profitability, please do not hesitate to contact me at dan@mchenryconsulting.net.
Sources:
https://www.brainyquote.com/quotes/authors/r/rupert_murdoch.html
https://www.tableau.com/
https://www.gartner.com/doc/reprints?id=1-3TYE0CD&ct=170221&st=sb